Tutorial: End-to-End Nanopore Analysis
This tutorial walks through a complete analysis pipeline: loading a nanopore recording, preprocessing, event detection, and feature extraction. The code uses ionique’s API with synthetic data standing in for a real recording.
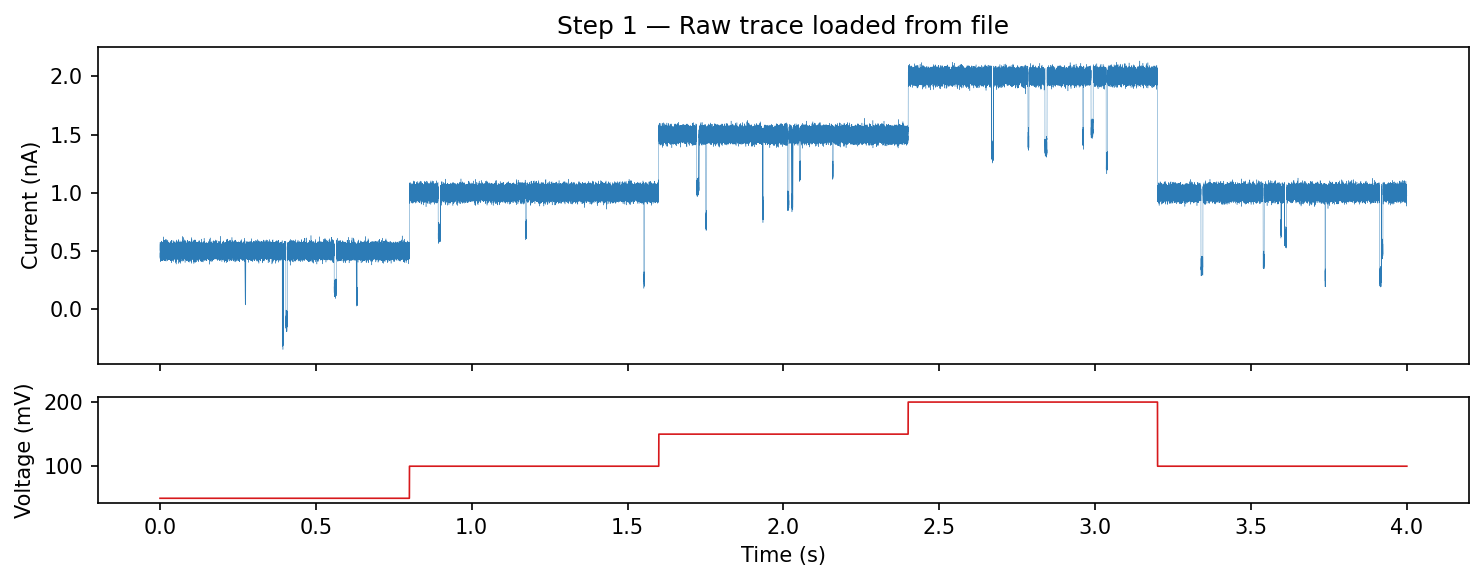
Step 1: Load the data
Load an EDH file with voltage-step splitting enabled. The reader returns
metadata, current, and voltage arrays. Wrap them in a TraceFile.
from ionique.io import EDHReader
from ionique.datatypes import TraceFile

metadata, current, voltage = EDHReader("experiment.edh", voltage_compress=True, downsample=1)
trace = TraceFile(current, voltage=voltage, metadata=metadata)

print(f"Samples: {trace.n}")
print(f"Sampling freq: {trace.sampling_freq} Hz")
print(f"Duration: {trace.n / trace.sampling_freq:.1f} s")
print(f"Voltage steps: {len(trace.children)}")
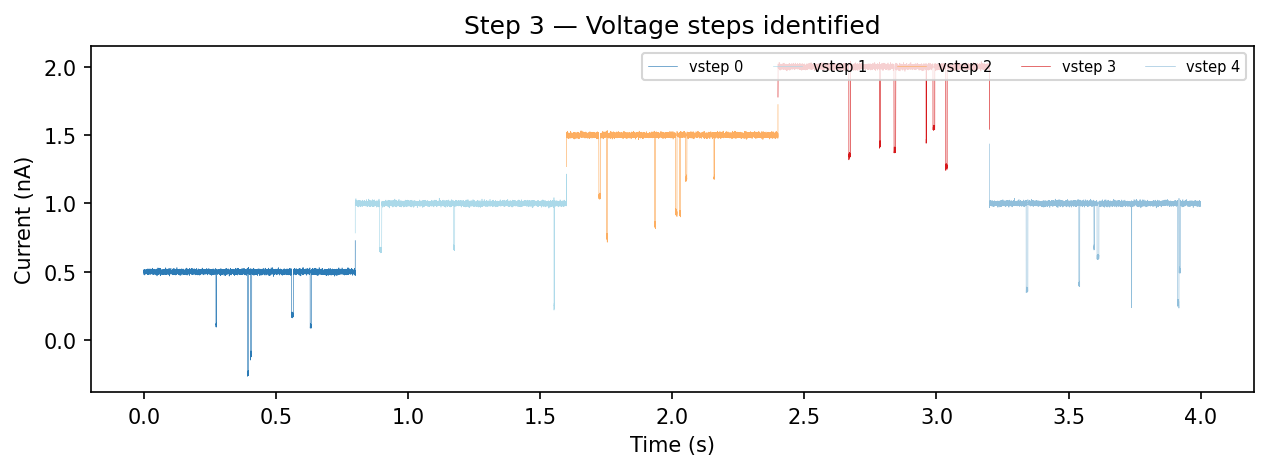
The trace now has children at rank "vstep" — one per constant-voltage
segment. Inspect them:
for i, vs in enumerate(trace.children):
    voltage = vs.get_feature("voltage")
    print(f"  vstep {i}: samples {vs.start}–{vs.end}, "
          f"V = {voltage*1000:.0f} mV, mean I = {vs.mean:.3f} nA")
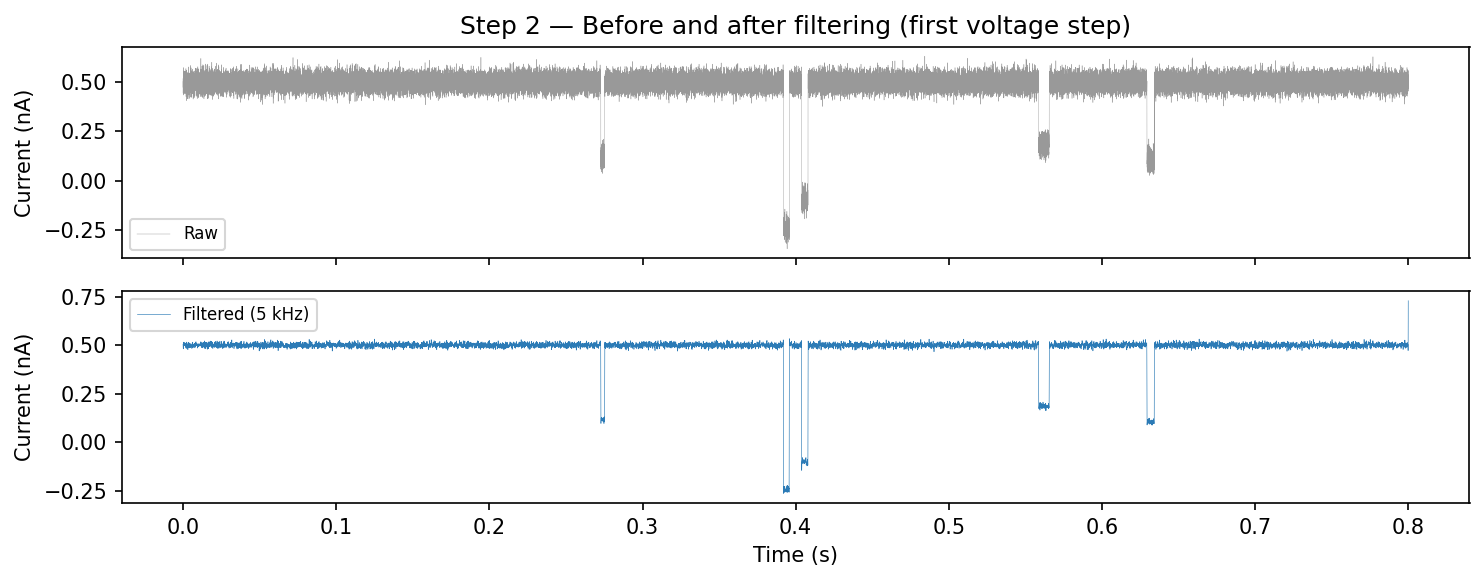
Step 2: Filter noise
Apply a 5 kHz lowpass Butterworth filter to remove high-frequency noise. The filter modifies the current array in place.
from ionique.utils import Filter

filt = Filter(
    cutoff_frequency=5000,
    filter_type="lowpass",
    filter_method="butter",
    order=2,
    bidirectional=True,
    sampling_frequency=trace.sampling_freq,
)
filt(trace.current)
Step 3: Trim voltage-step edges
Remove the first 500 samples of each voltage step to discard capacitive
transients. This creates children at rank "vstepgap" under each
"vstep".
from ionique.utils import Trimmer

trimmer = Trimmer(samples_to_remove=500)
trimmer(trace)

print(trace.summary())
# {'file': 1, 'vstep': 5, 'vstepgap': 5}
Step 4: Detect events
Use AutoSquareParser to find blockade events within each trimmed voltage
step. This detects regions where current drops below a fraction of the
open-channel baseline.
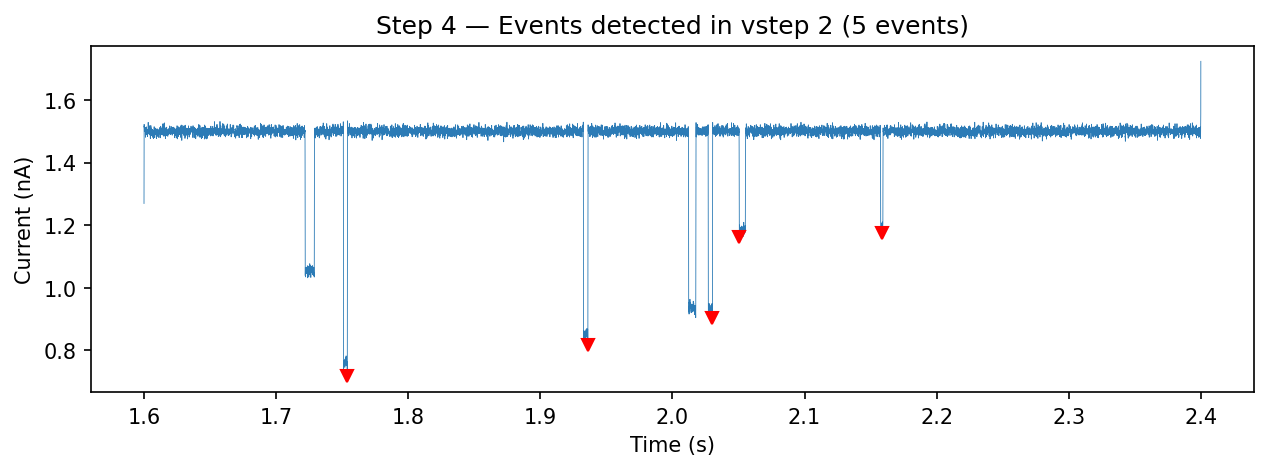
from ionique.parsers import AutoSquareParser

detector = AutoSquareParser(
    threshold_baseline=0.7,
    expected_conductance=1.9,
)
trace.parse(detector, newrank="event", at_child_rank="vstepgap")

events = trace.traverse_to_rank("event")
print(f"Total events detected: {len(events)}")
Inspect a few events:
for ev in events[:5]:
    print(f"  [{ev.start}:{ev.end}] n={ev.n}, "
          f"mean={ev.mean:.3f} nA, std={ev.std:.4f}")
If your events have multi-level current structure (e.g. a protein blocking in stages), you can further segment sub-states within each event:
from ionique.parsers import SpeedyStatSplit

splitter = SpeedyStatSplit(
    sampling_freq=trace.sampling_freq,
    min_width=50,
    window_width=10000,
)
trace.parse(splitter, newrank="state", at_child_rank="event")
Step 5: Extract features
Collect event statistics into a pandas DataFrame:
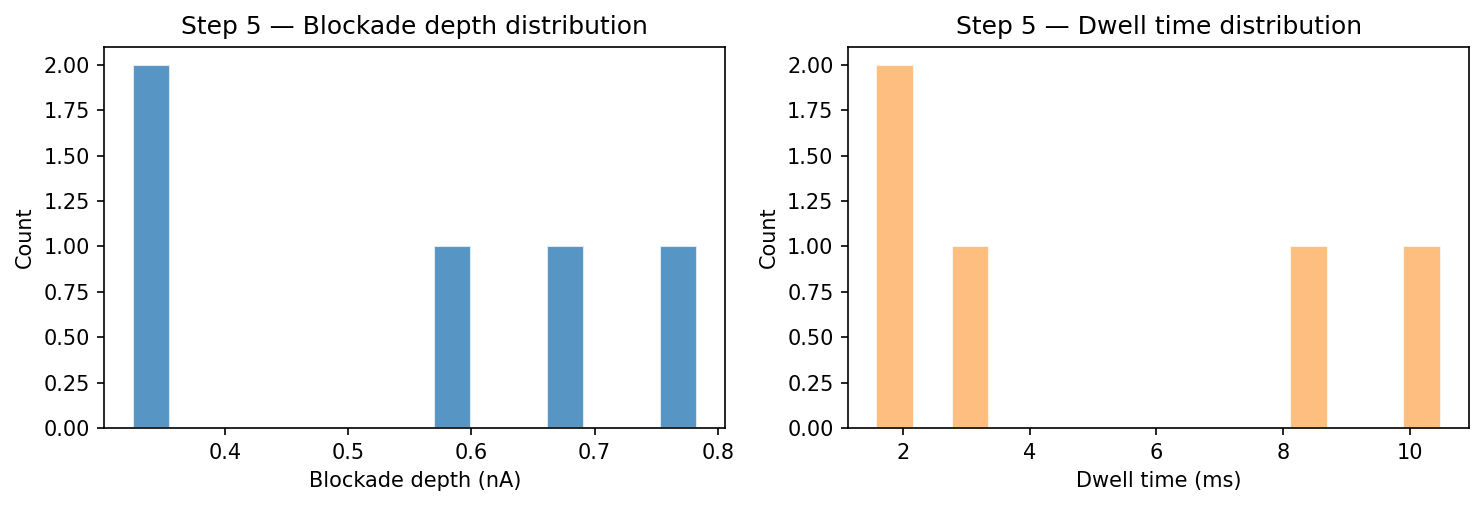
from ionique.utils import extract_features

df = extract_features(
    trace,
    bottom_rank="event",
    extractions=["mean", "std", "min", "max", "duration", "n", "start", "end"],
    lambdas={
        "blockade_depth": lambda seg: seg.climb_to_rank("vstepgap").mean - seg.mean,
        "voltage_mV": lambda seg: seg.get_feature("voltage") * 1000
            if seg.get_feature("voltage") else None,
    },
)

print(df.head())
print(f"\nTotal events: {len(df)}")
print(f"Mean blockade depth: {df['blockade_depth'].mean():.3f} nA")
print(f"Mean dwell time: {df['duration'].mean()*1000:.2f} ms")
Step 6: Visualize results
Plot the scatter of dwell time versus blockade depth:
import matplotlib.pyplot as plt

fig, ax = plt.subplots(figsize=(6, 4))
ax.scatter(
    df["duration"] * 1000,
    df["blockade_depth"],
    s=25, alpha=0.7, edgecolors="#333", linewidths=0.5,
)
ax.set_xlabel("Dwell time (ms)")
ax.set_ylabel("Blockade depth (nA)")
ax.set_title("Event scatter")
plt.tight_layout()
plt.show()
You can also use qp_trace() to see events overlaid on the trace:
from ionique.plotting import qp_trace

qp_trace(
    trace,
    ranks=["vstepgap", "event"],
    downsamples={"vstepgap": 50, "event": 1},
    plot_voltage="split",
)
Summary
The complete pipeline:
from ionique.io import EDHReader
from ionique.datatypes import TraceFile
from ionique.parsers import AutoSquareParser, SpeedyStatSplit
from ionique.utils import Filter, Trimmer, extract_features

# Load
metadata, current, voltage = EDHReader("experiment.edh", voltage_compress=True)
trace = TraceFile(current, voltage=voltage, metadata=metadata)

# Preprocess
Filter(cutoff_frequency=5000, filter_type="lowpass",
       sampling_frequency=trace.sampling_freq)(trace.current)
Trimmer(samples_to_remove=500)(trace)

# Detect events
detector = AutoSquareParser(threshold_baseline=0.7, expected_conductance=1.9)
trace.parse(detector, newrank="event", at_child_rank="vstepgap")

# (Optional) Segment sub-states within events
splitter = SpeedyStatSplit(sampling_freq=trace.sampling_freq, min_width=50)
trace.parse(splitter, newrank="state", at_child_rank="event")

# Extract features
df = extract_features(trace, "event", ["mean", "std", "duration"])
Next steps:
Try different parsers — see Parsers Guide.
Customize preprocessing — see Signal Preprocessing.
Build IV curves — see Signal Analysis.
Explore events interactively — see Visualization.