Getting Started
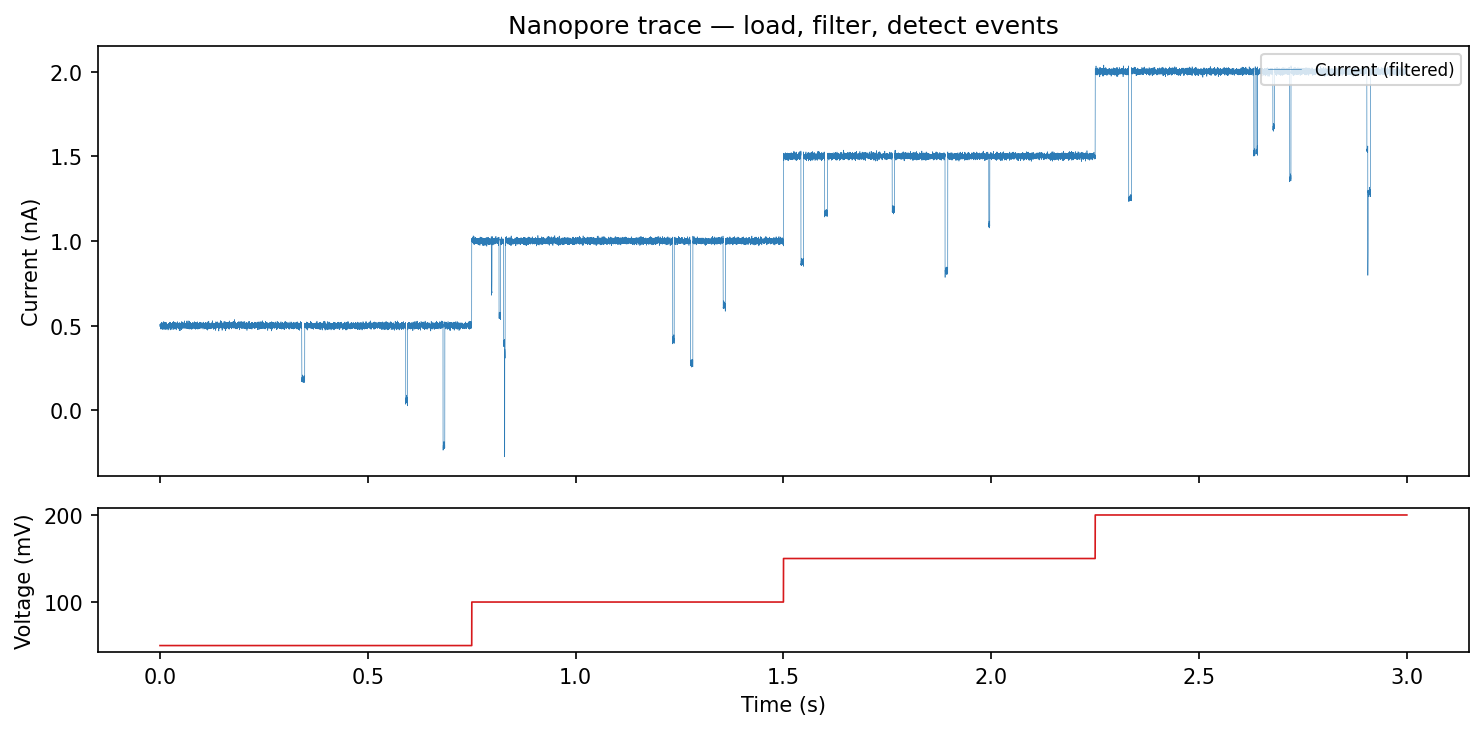
This page walks through a complete ionique workflow in under five minutes: load a nanopore recording, filter noise, detect events, and extract features.
Minimal workflow
from ionique.io import EDHReader
from ionique.datatypes import TraceFile
from ionique.parsers import AutoSquareParser, SpeedyStatSplit
from ionique.utils import Filter, Trimmer, extract_features

# 1. Load an EDH file with voltage-step splitting
metadata, current, voltage = EDHReader("experiment.edh", voltage_compress=True)
trace = TraceFile(current, voltage=voltage, metadata=metadata)

# 2. Filter high-frequency noise
filt = Filter(
    cutoff_frequency=5000,
    filter_type="lowpass",
    sampling_frequency=trace.sampling_freq,
)
filt(trace.current)

# 3. Trim transient artifacts at voltage-step edges
trimmer = Trimmer(samples_to_remove=200)
trimmer(trace)

# 4. Detect blockade events
detector = AutoSquareParser(threshold_baseline=0.7, expected_conductance=1.9)
trace.parse(detector, newrank="event", at_child_rank="vstepgap")

# 5. (Optional) Segment sub-states within each event
splitter = SpeedyStatSplit(sampling_freq=trace.sampling_freq, min_width=50)
trace.parse(splitter, newrank="state", at_child_rank="event")

# 6. Extract features to a pandas DataFrame
df = extract_features(trace, "event", ["mean", "std", "duration"])
print(df.head())
Every step adds structure to a segment tree — a hierarchy where each node represents a contiguous slice of the current trace.
The segment tree
ionique organizes data as a tree of segments. Parsing subdivides parent segments into children at a new rank:
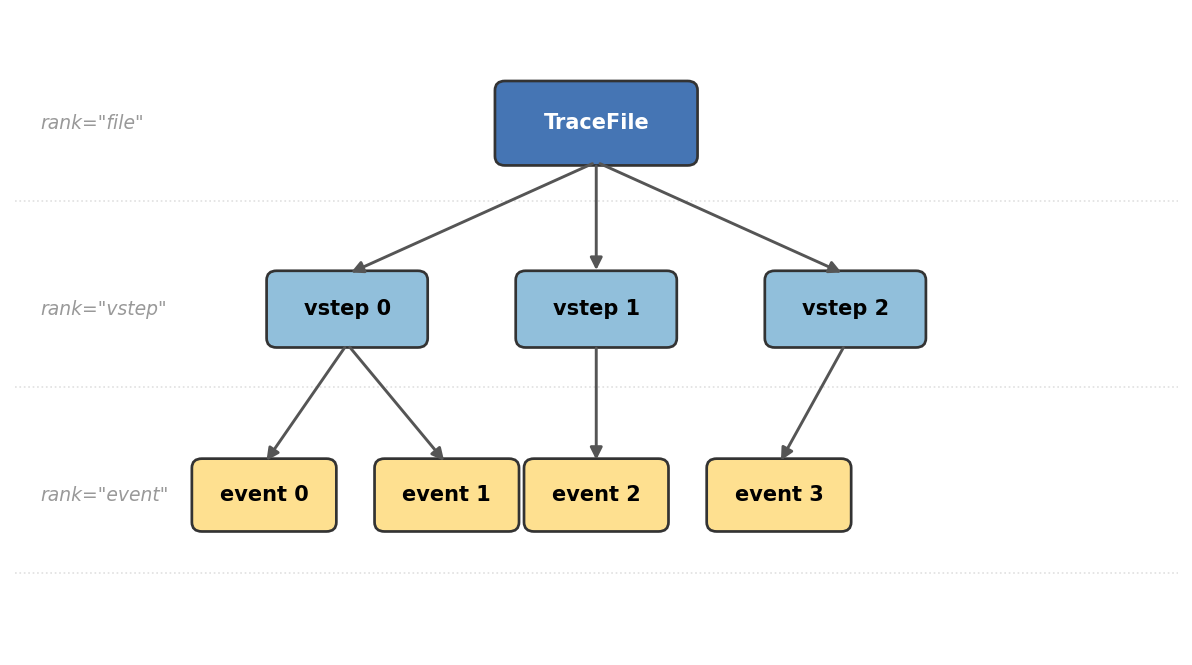
TraceFile (rank
"file") — the full recording with current, voltage, and metadata.Voltage steps (rank
"vstep") — created automatically when you load withvoltage_compress=True. Each step corresponds to a constant applied voltage.Events (rank
"event") — detected by an event detector (AutoSquareParser, SpikeParser, or lambda_event_parser) within each voltage step (or trimmed step,"vstepgap").States (rank
"state", optional) — sub-states within an event, resolved by SpeedyStatSplit when events have multi-level current structure.
You can traverse down with traverse_to_rank() and up with
climb_to_rank(). Features like sampling_freq are looked up by climbing
the tree until found.
What’s next
Data Input — loading different file formats and understanding TraceFile.
Core Concepts — the segment tree model in depth.
Signal Preprocessing — filtering and trimming options.
Parsers Guide — choosing and configuring a parser.
Signal Analysis — extracting features and building IV curves.
Visualization — plotting traces and events with
qp_trace().Tutorial: End-to-End Nanopore Analysis — end-to-end walkthrough with synthetic data.